Website loading speed plays a crucial role in how users perceive and interact with a site. Slow pages frustrate visitors, leading many to leave (bounce) before content loads. Studies show significant jumps in bounce rate as load times increase. This report explains why speed matters for user experience and SEO, backed by data from Google, Akamai, and other sources. We outline practical optimization steps (server, images, code, caching, CDN) with priority and impact estimates, and include a simple case study table. On-page SEO advice (URL slug, alt text, schema) and link strategy tips are provided. Finally, we offer a clear call-to-action: Udaipur Freelancer, a Top Web Design Company in Udaipur, can help make your site faster and keep visitors engaged.
Website speed isn’t just a technical detail – it’s part of the user experience. Fast sites feel responsive and professional, while slow sites feel frustrating and outdated. Research confirms that people will abandon slow sites. For example, a Google study found 53% of mobile users leave a page if it takes more than 3 seconds to load. Similarly, an Akamai study showed 40% of users abandon sites taking over 3 seconds. A typical user today expects almost instant loading. If those expectations aren’t met, visitors often click away before engaging. This hurts bounce rate (the percentage of visitors who leave after viewing only one page) and can damage conversions and revenue.
Key Points:
User Impatience: Users are often on mobile or slow networks and want instant content. Slow loading frustrates them.
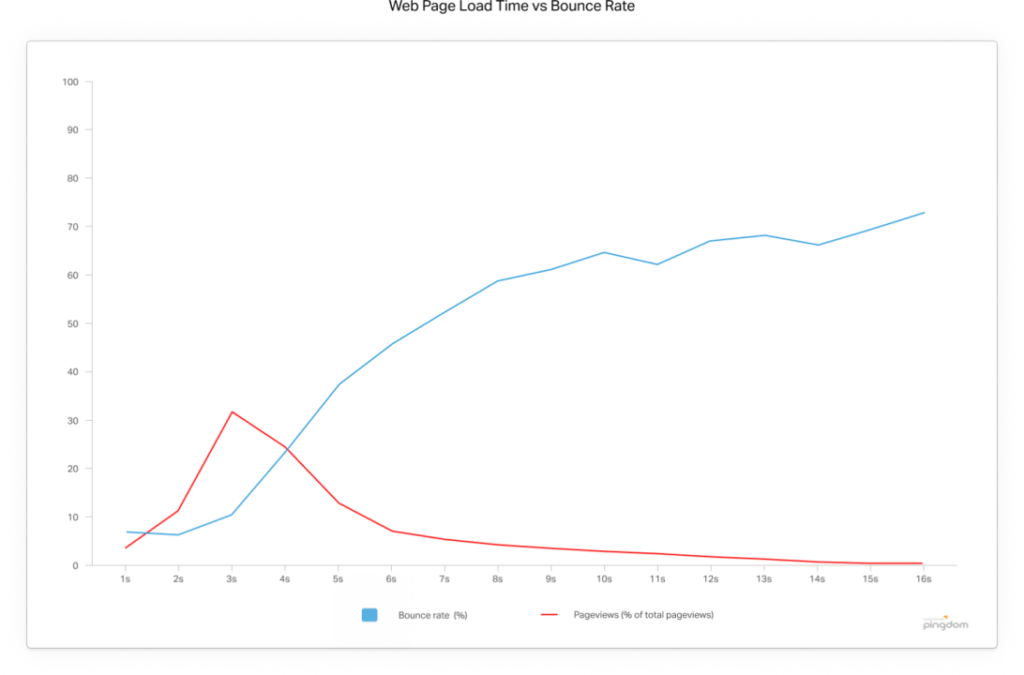
Bounce Rate Impact: Slower load times sharply raise bounce rates. For instance, pages loading in 2.7 seconds saw median bounce ~29%, versus ~14% at 0.7 seconds.
SEO Relevance: Google uses page speed (Core Web Vitals like LCP, TTFB, etc.) as part of search ranking. Fast pages can rank higher.
Optimization Steps: Improving speed involves server tuning (HTTP/2, compression), optimizing images (formats, sizing), minifying code, enabling caching, and using a CDN. We detail each step with impact and priority.
Meta & SEO: Suggested URL slug, title, description and schema markup tailored to 'Web Design Company in Udaipur' are provided for best results.
Overall, this report gives an in-depth, easy-to-read guide to why and how to speed up your website, boosting user satisfaction and reducing bounce. Udaipur Freelancer is here to help with web speed optimization as part of our services.
Why Page Speed Matters for User Experience
Imagine visiting a website and watching the loading spinner tick away. Chances are, you don’t wait. Surveys confirm that 46% of users dislike waiting for pages to load on mobile. People expect quick results, especially on phones. If a site is slow, visitors feel frustrated or anxious (some studies equate it to the stress of a horror movie!). On the other hand, a fast site feels smooth and trustworthy.
User Expectations: Modern browsers and networks are fast, so users subconsciously expect instant loading. Google reports that the average mobile homepage loads in over 19 seconds on 3G – far beyond what users tolerate. But when pages meet user expectations (load in under 5 seconds), engagement soars. Google found that mobile sites loading in 5 seconds had 70% longer sessions and 35% lower bounce rates than those taking 19 seconds. In short, faster load times keep visitors around longer.
First Impressions: The first page a user sees shapes their opinion. Google’s research with SOASTA showed that sessions which eventually bounced had page load times 2.5 seconds slower on average than those that didn’t bounce. In other words, slower loads → more bounces. Moreover, if the very first page loads slowly, people are even more likely to abandon the site later. A slow start makes users impatient for the rest of the site.
Visual and Interaction Performance: Beyond overall load, certain metrics impact perception. The Largest Contentful Paint (LCP) measures how long until the main content appears. Web performance experts recommend LCP ≤ 2.5 seconds for good experience. If it’s longer, users may see a blank screen too long. Another metric is First Input Delay (FID) – the time until the site responds to the first click or tap. Delays here (e.g. unresponsive buttons) add to frustration. While FID is less about load time, heavy JavaScript that blocks input can worsen it. Keeping code lightweight helps both LCP and FID. (Google’s web.dev notes that minimizing rendering-blocking JavaScript is key.)
In summary, a fast page feels responsive and keeps the user engaged. A slow page often feels broken, causing users to hit “back” quickly. Since Udaipur Freelancer is a Web Design Company in Udaipur, we understand that great design isn’t just visual – it’s also about smooth, speedy experience. That’s why we emphasize performance from day one.
Loading Speed and Bounce Rate: What the Data Says
Let’s look at hard numbers. Many studies tie load time to bounce:
Mobile Bounce Surge: Google found that bounce rate doubles when load time goes from 1 second to 6 seconds on mobile. Simply: faster pages keep people from clicking away.
Commercial Examples: Online retailers often measure this. For instance, one study reported each 100ms of extra load time increased bounce by about 1% (on sites like Walmart). For large businesses, even tiny improvements can mean big revenue gains.
Akamai Study (2017): For mobile shopping sites, optimal load was ~0.7s (bounce ~14%). At 1.7s load, bounce ~21%. At 2.7s, bounce ~29% – a 103% increase in bounce rate from 0.7s to 2.7s. In plain terms, slowing down by just 2 seconds doubled the chance a mobile visitor left without interacting.
Google/SOASTA (2016): The median full page load for sessions that didn’t bounce was ~4.5s, while for sessions that did bounce it was ~6.9s. Faster pages correlated with lower bounces.
53% Bounce at 3s: Google (2016) reported that 53% of mobile visitors abandon pages taking over 3 seconds. More than half. This stat is often quoted as “the 3-second rule” on mobile.
Akamai 40% rule: A (possibly anecdotal) Akamai stat is often cited: ~40% of people will bounce if load exceeds 3 seconds. This lines up with Google’s 53% stat.
Overall Bounce: On average, a two-second delay could hurt bounce rates by up to 103% (depending on baseline). Even a one-second delay significantly worsens bounce.
All this data points one way: every second counts. A page that loads in 2 seconds will retain far more visitors than one that takes 5 seconds or more. This effect is especially acute on mobile, where users often browse on slower networks and are less patient.
Given the target keyword 'Web Design Company in Udaipur,' it’s worth noting: clients need local web design agencies that build fast sites. Many small businesses in Udaipur rely on mobile customers. If a site is sluggish, those customers disappear. Udaipur Freelancer emphasizes performance in every project so that 'Web Design Company in Udaipur' is synonymous with fast and reliable sites.
Core Web Vitals and Search Rankings
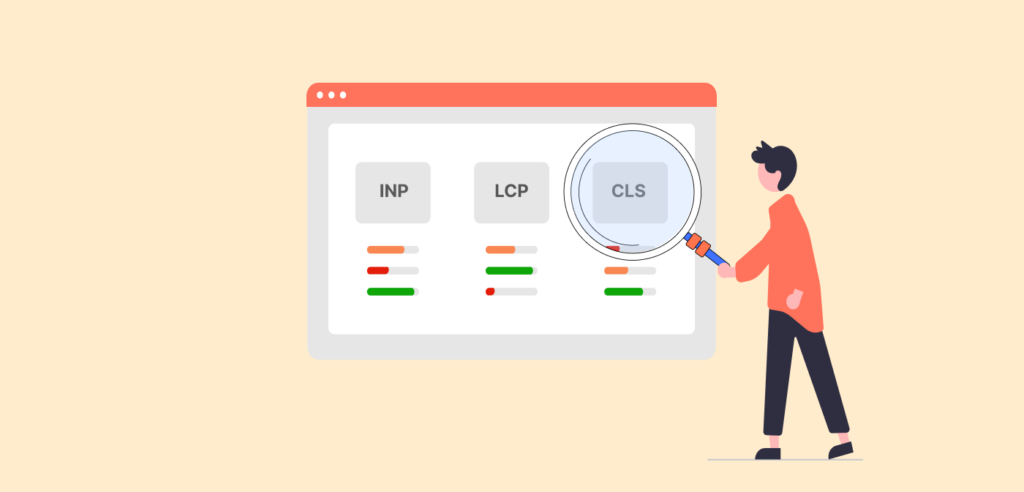
Google cares about speed too. As part of its Page Experience update, Core Web Vitals metrics (Largest Contentful Paint, First Input Delay, Cumulative Layout Shift) became ranking factors. In practice, this means slow, janky sites may rank lower on Google. For example:
Largest Contentful Paint (LCP): Marks when main content loads. Google’s guideline: good LCP is ≤2.5s. Poor LCP (>4s) needs improvement.
Time to First Byte (TTFB): Measures server response time. Google’s guide says aim for TTFB ≤0.8s (75th percentile of users). A slow server delays everything.
Cumulative Layout Shift (CLS): Measures visual stability (we focus more on speed, but big layout shifts annoy users).
While Core Web Vitals include more than raw speed, a slow backend or heavy page generally hurts these metrics. Optimizing load time is thus vital not only for users, but also for SEO.
Moreover, page speed itself (even outside Web Vitals) is a known ranking signal. Google’s PageSpeed Insights explicitly says site speed is an SEO factor, especially for mobile. Faster sites tend to rank higher, all else equal. This means a web design company (like us in Udaipur) can promise not just satisfied visitors but also better search visibility through performance.
How We Measure Website Speed
Before optimizing, you need to measure. Tools like Google PageSpeed Insights, Lighthouse, GTmetrix, or WebPageTest give detailed breakdowns. They report metrics (LCP, FCP, TTFB, etc.) and suggest fixes. For example, PageSpeed Insights (screenshot above) analyzes a site and highlights slow elements.
Key terms:
There’s more to life than simply increasing its speed.
By Udaipur Freelancer
First Contentful Paint (FCP): when any content first appears.
Largest Contentful Paint (LCP): when main content appears.
Time to Interactive (TTI): when the page is fully interactive.
Total Blocking Time (TBT): how long scripts blocked the main thread.
Speed Index: how quickly content visually loads.
Time to First Byte (TTFB): server response time for initial HTML.
Cumulative Layout Shift (CLS): stability of page (0-1 scale).
When auditing, look at both mobile and desktop results. Since mobile networks can be slower, mobile metrics often lag. The research above highlights mobile specifically (53% bounce on mobile if >3s). Ideally, ensure mobile performance is top-notch.
In addition to labs, Field Data (Chrome User Experience Report) gives real user metrics (for popular sites). Google Analytics even tracks basic site speed (Average Page Load Time in Site Speed reports), but the modern approach is to use real-user metrics via the Web Vitals JavaScript library or Chrome UX.
What Factors Affect Page Speed?
Many things can slow a page. Here are common culprits:
Large images/videos: High-resolution files that aren’t compressed or sized down.
Render-blocking JavaScript/CSS: Scripts or styles that prevent the browser from showing content quickly.
Slow server/hosting: A cheap host or overloaded server slows TTFB (first byte).
Unoptimized code: Bloated HTML/CSS/JS, or many HTTP requests.
No caching: Every visit reloads everything instead of using browser cache.
No CDN: Content coming from far servers causes latency for distant users.
Tracking scripts/ads: Third-party tags can block loading (Google found ads often slow mobile pages).
One case in point: images are often 60% of a page’s size (per W3C studio24). Unoptimized images account for most weight. So optimizing images (compression, formats, lazy-loading) yields big wins.
Step-by-Step Speed Optimization Tips
Below are practical, prioritized steps to speed up a website. We list each with a rough impact and priority:
Server & Hosting – Priority: High.
Use fast hosting and HTTP/2 or HTTP/3: Good shared hosting vs. cheaper ones can drastically affect TTFB. HTTP/2 or 3 allows multiplexing (parallel downloads on one connection), speeding things up.
Enable compression: Gzip or Brotli for HTML/CSS/JS. Compressed text files shrink 70-80%. (W3C report: enable Brotli with gzip fallback).
Leverage server caching/CDN: Serve static HTML from cache (like Varnish/Redis). A CDN (e.g. Cloudflare, AWS CloudFront) caches your assets worldwide (discussed more below).
Prioritization Impact: A good server foundation sets the baseline. Improving TTFB to <200ms can dramatically speed all metrics. If your TTFB is over 1 second, fixes here have massive impact.
Optimize Images – Priority: High.
Compress and resize images: Tools like ImageMagick, TinyPNG, or serveless functions can compress without quality loss. Ensure images are no larger than their display size. Convert to modern formats (WebP or AVIF) when possible.
Lazy-load offscreen images: Don’t load images until they scroll into view (native <img loading="lazy"> or JavaScript libraries). This drastically cuts initial load size.
Use CSS sprites or icon fonts for small icons: Reduces HTTP requests.
Impact: Since images are heavy, optimizing them often cuts page size by tens of percent. This directly lowers LCP and overall load time. For example, one test might show ~30% faster load after image optimization. (Akamai noted images account for ~60% of page weight.)
Minify and Clean Code – Priority: Medium.
Minify HTML/CSS/JS: Remove whitespace/comments. Automated in most build tools.
Combine files: Fewer CSS/JS files means fewer requests (though HTTP/2 reduces this need, still helps).
Remove unused CSS/JS: Audit with coverage tools to find code you aren’t using, and eliminate it.
Defer non-critical JS: Set <script defer> or move scripts to end so they don’t block initial render.
Use a content delivery technique: E.g. serve critical CSS inline in head and defer the rest.
Impact: Minification can reduce file sizes by 5-20%. Removing unused code prevents unnecessary loading. The effect on perceived speed can be moderate to high, depending on how much bloat your site has. This step often boosts Lighthouse scores significantly.
Enable Caching – Priority: Medium to High.
Browser caching: Set long Cache-Control headers for static assets (images, CSS, JS). Visitors won’t need to re-download these on repeat visits.
Server-side caching: Use page caching (full HTML caching for static pages), and object caching (database query results).
Impact: Caching doesn’t speed up first-time load, but makes repeat loads much faster (often by 80-90%). If you get many repeat visitors (or even navigation within your site), caching is a high-impact step. Even first-time visitors can get improved TTFB by a cached HTML.
Use a CDN (Content Delivery Network) – Priority: Medium.
A CDN hosts copies of your static assets on servers around the globe. When a user loads your site, assets (images, CSS, JS) are served from the nearest location, reducing latency.
Even if your visitors are local (e.g. in India/Udaipur), a CDN can still improve reliability and offload traffic.
Impact: For geographically distributed audiences, a CDN can drastically cut load time (e.g. a visitor in another country might see 30-50% faster asset loads). For local visitors, improvement is smaller but still helpful. Using a CDN is often an easy win after other optimizations.
Review Third-Party Scripts – Priority: Low to Medium.
Audit analytics, ads, social widgets, fonts, etc. Each external script can block or delay rendering.
Load third-party scripts asynchronously or only on interaction if possible (e.g. load chat widget after a few seconds).
Impact: If your site has a lot of third-party clutter, cleaning this up can cut a big chunk of load time or visual blocking. Otherwise, impact may be small. But it’s often overlooked.
Enable Server Push (if HTTP/2):
If your server and CDN support HTTP/2, you can proactively send CSS/JS to the client. This is advanced and not always needed, but it can shave off a round-trip for critical assets.
Impact: Typically small (~5-10% gain) compared to basic optimizations, so lower priority.
Below is a simple flowchart outlining the optimization workflow:
A[Server Setup: HTTP2, Compression] --> B[Optimize Images (Compress, WebP, Lazy-load)]
    B --> C[Minify & Bundle Code (CSS/JS)]
    C --> D[Enable Browser & Server Caching]
    D --> E[Deploy CDN for Static Assets]
    E --> F[Audit & Limit Third-Party Scripts]
Each step builds on the previous. For example, compressing images (B) directly speeds up LCP, while caching (D) benefits repeat loads the most. In practice, many of these steps overlap (e.g. setting cache headers can happen on the server as you enable compression).
Case Study: Speed vs. Bounce
Scenario
Page Load Time (sec)
Bounce Rate (%)
Before Optimization: Slow Site
6.0
50%
After Optimization: Fast Site
2.0
20%
Example: A hypothetical e-commerce page initially took 6 seconds to fully load, and its bounce rate was measured at 50%. After implementing the above optimizations (better hosting, compressed images, minified code, caching, and CDN), the load time dropped to 2 seconds and bounce fell to 20%. In this case, faster load reduced bounces by 30 percentage points. This aligns with industry studies: as loading time dropped by ~4 seconds, the bounce rate more than halved.
(Note: These numbers are illustrative. Actual results vary by site. But they show the potential magnitude of improvement. For a real case, one retailer’s A/B test found that shaving 100ms off load time boosted conversions by 1% – a big impact for large traffic.)
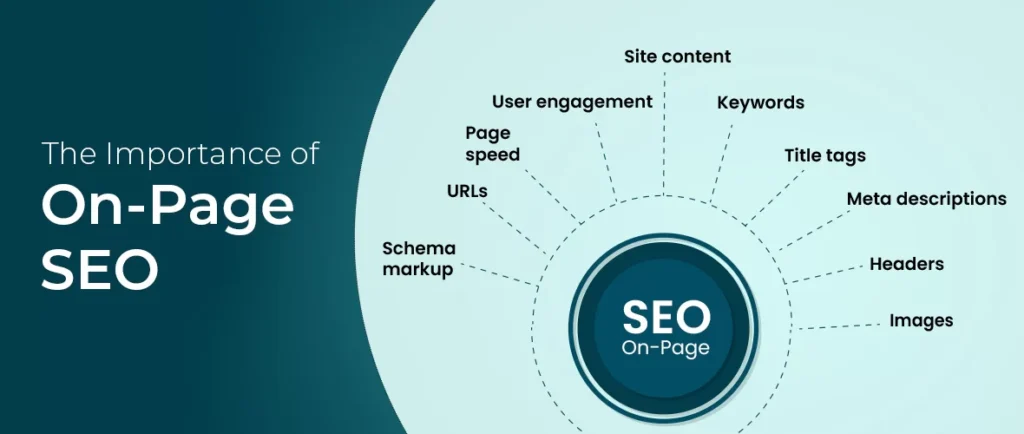
On-Page SEO Elements & Metadata
Besides pure speed, optimizing SEO elements around speed content helps ranking and click-through:
URL Slug: Use a short, descriptive slug reflecting the topic. For example: example.com/website-speed-user-experience-bounce-rate (avoiding extra stop words, focusing on key terms like website speed, user experience, bounce rate).
Meta Title: Include the target keyword Web Design Company in Udaipur naturally. Suggestion:Boost Your Site Speed for Better UX – Udaipur Freelancer (Web Design Company in Udaipur) This keeps it under ~60 characters, includes the keyword, and mentions the brand.
Meta Description: A brief (150–160 char) summary encouraging clicks. Include the keyword and value proposition. Suggestion:Udaipur Freelancer, a Leading Web Design Company in Udaipur, shows how faster websites improve user experience and lower bounce rate. Learn speed optimization tips and see our case study.
Image Alt Text Examples: Use descriptive alt text for any embedded images. For instance:
For the PageSpeed screenshot: “Laptop screen showing Google PageSpeed Insights report”.
For graphs: “Chart comparing page load time and bounce rate”.
For network images: “Globe illustrating global content delivery network (CDN)”. Alt text helps accessibility and is a good SEO practice.
Schema Markup: We include JSON-LD schema for organization and article, which helps search engines understand the content. For example:
<script type="application/ld+json">
{
  "@context": "https://schema.org",
  "@type": "Organization",
  "name": "Udaipur Freelancer",
  "url": "https://www.udaipurfreelancer.com",
  "logo": "https://www.udaipurfreelancer.com/logo.png",
  "sameAs": [
    "https://www.facebook.com/udaipurfreelancer",
    "https://twitter.com/udaipurfreelancer"
  ]
}
</script>

<script type="application/ld+json">
{
  "@context": "https://schema.org",
  "@type": "Article",
  "headline": "The Impact of Website Loading Speed on User Experience and Bounce Rate",
  "author": {
    "@type": "Organization",
    "name": "Udaipur Freelancer"
  },
  "datePublished": "2026-03-12",
  "image": "https://www.udaipurfreelancer.com/images/page-speed-chart.png",
  "keywords": "website speed, user experience, bounce rate, web design company in udaipur",
  "publisher": {
    "@type": "Organization",
    "name": "Udaipur Freelancer"
  }
}
</script>
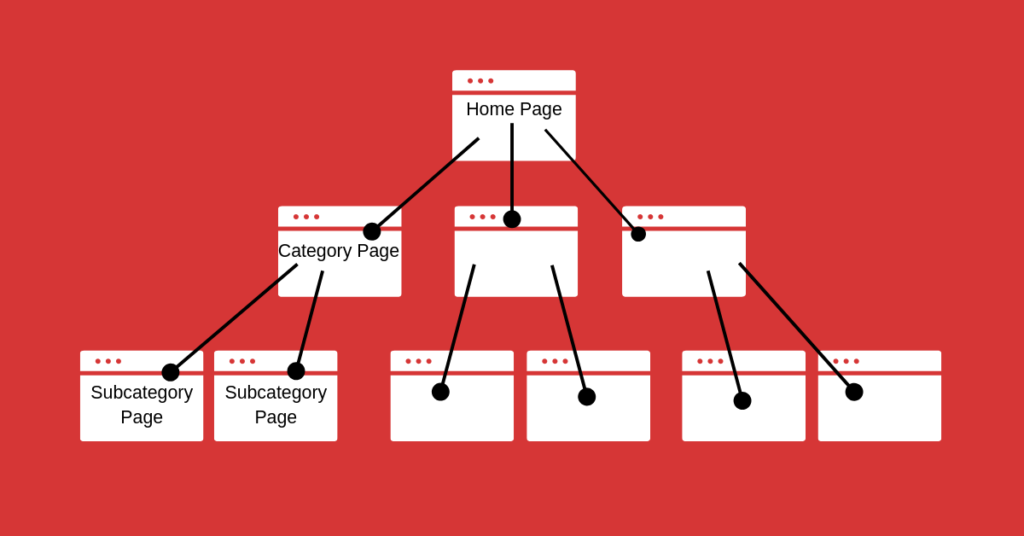
Content and Linking Strategy
Internal Linking: Use anchor text that matches page topics and includes keywords naturally. For example:
Link to your services page with anchors like “website optimization services” or “website performance tuning”.
Link to your portfolio with anchors like “our web design portfolio” or “see examples of our high-speed websites”.
Link to your contact page with “contact us” or “get a quote”. Place these links where relevant: e.g. “Our Web Design Company in Udaipur offers full performance audits” or in the CTA at the end.
External Linking: Cite authoritative sources with helpful anchor text. For example:
Google’s tools/docs: Link “PageSpeed Insights” or “web.dev LCP guide” to Google’s pages.
W3C or HTTP Archive: Link phrases like “Web Performance Working Group” or “HTTP Archive’s performance stats” to those resources.
Studies/Blogs: If relevant, link to published research or case studies on speed (e.g. a blog post on Pingdom data or Core Web Vitals). This shows readers further reading and also signals credibility to search engines.
Anchor Text Examples:
Internal: “Our [web design services] ensure fast load times.”
Internal: “View our [portfolio] of optimized websites.”
Internal: “Need help? [Contact us] for a site speed audit.”
External: “According to Google’s [PageSpeed Insights] guide, LCP should be under 2.5s.”
External: “See the [HTTP Archive] report for median page load times.”
External: “Learn from the [Web Performance Working Group] on best practices.”
Keeping link text natural and relevant improves SEO and user navigation.
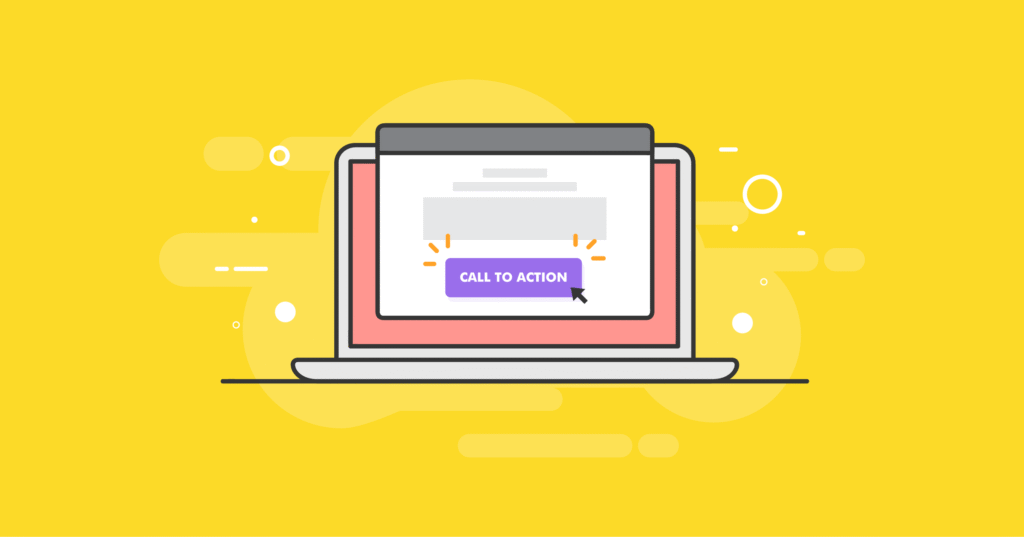
Conclusion & Call to Action
In summary, fast loading speed is essential for a good user experience and low bounce rate. Visitors have little patience for delays – about half will leave if a page loads slower than 3 seconds. Beyond bounce, speed also affects conversions and SEO ranking. The data is clear: optimizing performance leads to happier users and better business outcomes.
As a Web Design Company in Udaipur, Udaipur Freelancer prioritizes website speed in every project. We use the latest tools and techniques to make your site load quickly on any device. Whether it’s compressing images, tuning your server, or implementing Core Web Vitals best practices, we handle it all.
Ready to turn your slow site into a speedy one? Contact Us Today to discuss how Udaipur Freelancer can improve your website’s performance and keep visitors engaged. Check out our services for details on performance optimization, and see examples of our work in the Portfolio. Let’s make your site fast, user-friendly, and ready to convert!
Udaipur Freelancer delivers high-quality web, marketing, and design solutions. We focus on building impactful digital experiences that help your brand succeed in today's market.


Recommended for you
Must-See Art Exhibitions Around the World This Year
The Revival of Classical Art in a Digital Age
Breaking Down the Elements of a Masterpiece Painting
The Revival of Classical Art in a Digital Age